Interactive Pivot Tables
Quick access to important information
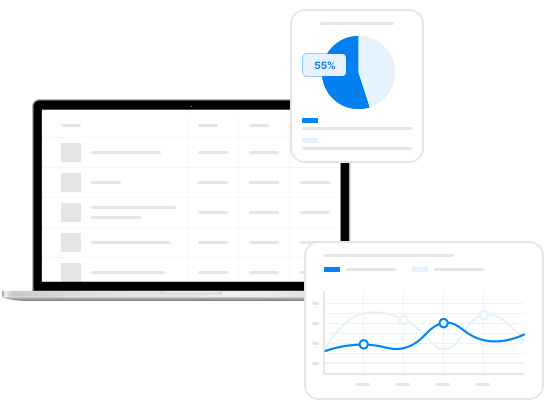
Interactive Pivot Tables are an analytical tool that enables dynamic analysis of data on prices and shelf shares in retail chains. The tool is ideal for manufacturers and retail chains that need quick access to important information and support in making strategic decisions.

Functionalities:
- Dynamic Drag and Drop: Users can easily customize the data view according to their needs by dragging and dropping various variables into the pivot table.
- Detailed Analysis: The tool transforms raw data into understandable summaries and reports that reveal hidden patterns and relationships.
- Interactive Filtering and Grouping: Enables accurate data filtering and grouping according to criteria such as product categories, store locations, or time periods.
- Data Visualization: The tool allows you to generate charts and diagrams directly from pivot tables, which facilitates the interpretation of analysis results.

Benefits:
- Precise Data Analysis: Enables accurate processing and analysis of large data sets.
- Effective Information Management: Quick adaptation of analyzes and reports to changing needs increases flexibility in data management.
- Better Strategy Planning: Enables you to identify trends and optimize your pricing strategies.
For whom?
- Manufacturers: Analyze data on prices, promotions and product availability.
- Retail Chains: They analyze data on the assortment, product price levels and shelf shares in selected categories.
- Market Analysts: Conduct detailed market analyses, creating reports to support strategic decisions.
Contact us
and test!
and test!


