Analyzing product prices in various retail chains
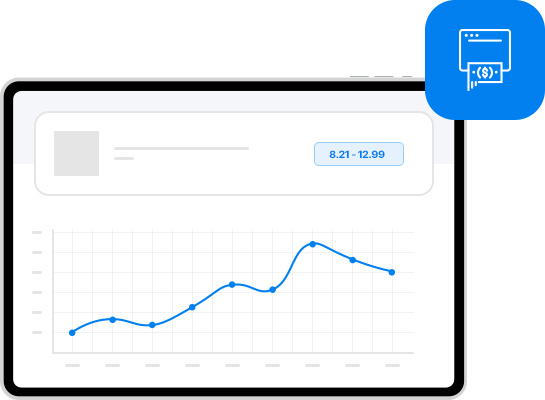
Price Charts are an advanced analytical tool for producers and retail chains, enabling monitoring and analysis of product prices in various retail chains. The tool generates price charts and comparison charts, making it easier to understand price changes and market trends.

Functionalities:
- Generating Price Charts and Comparison Charts: The tool allows you to create both charts showing price changes over time and comparison charts that visualize differences between retail chains.
- Historical Price Analysis: Provides access to detailed historical data on product prices, allowing you to analyze long-term trends and seasonal patterns.
- Price Comparison in Retail Chains: Enables the assessment of price competitiveness and identification of the best locations for selling products.
- Intuitive Application: A clear interface allows you to quickly create reports and charts, even for people without advanced technical knowledge.

Benefits:
- Pricing Policy Optimization: Accurate data and charts help you adjust your pricing strategy, which allows for better positioning of your products in the market.
- Response to Market Changes: Monitoring prices in real time allows you to quickly adjust your pricing policy and plan effective promotions.
- Business Decision Support: Detailed analysis of price trends supports strategic business decisions.
Contact us
and test!
and test!


